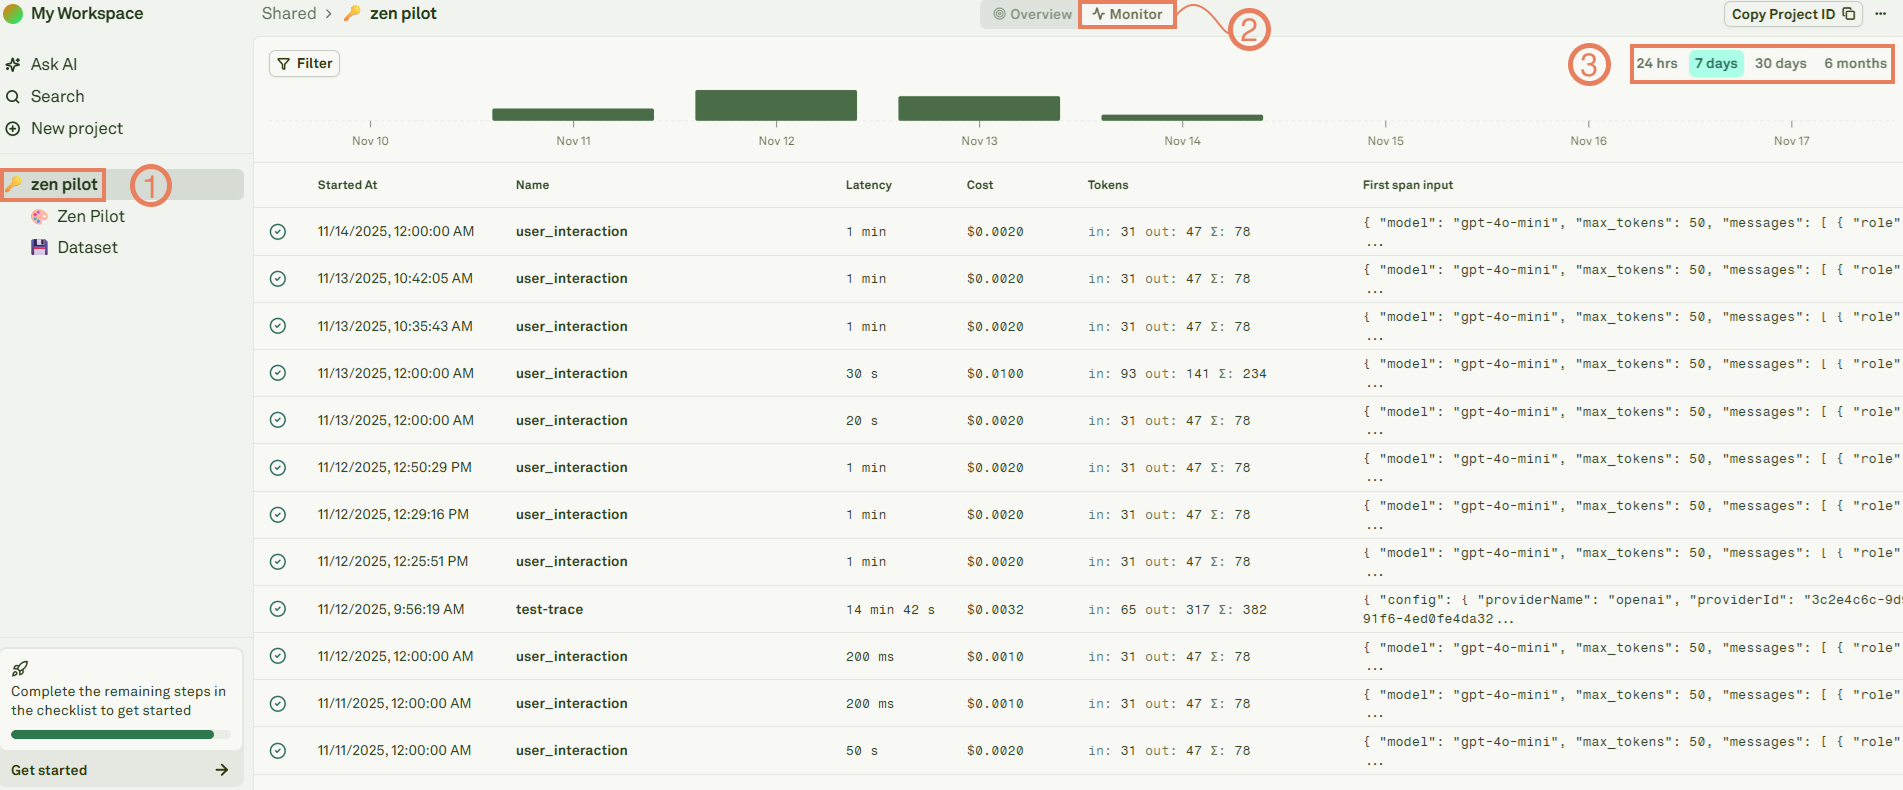
The Monitor pillar allows you to view, filter, and search traces and spans and the data associated with them. Before using the Monitor pillar, you must send traces and spans to Adaline. Please refer to the API References or SDK References to learn how to send traces and spans to Adaline.

Viewing Traces and Spans

In Adaline, a project represents an AI agent / workflow and each trace sent to Adaline is always associated with a project. You can view all the traces associated with a project in the Monitor section of your project. Monitor traces in Adaline Select a trace to view the trace tree and trace data, metrics and metadata. You can view all the spans in the trace tree and view and span by clicking on it. Visualize traces as trees in Adaline Alternatively, you can view the waterfall view instead of the trace tree. Visualize traces as waterfall in Adaline
Viewing a specific prompt’s spans

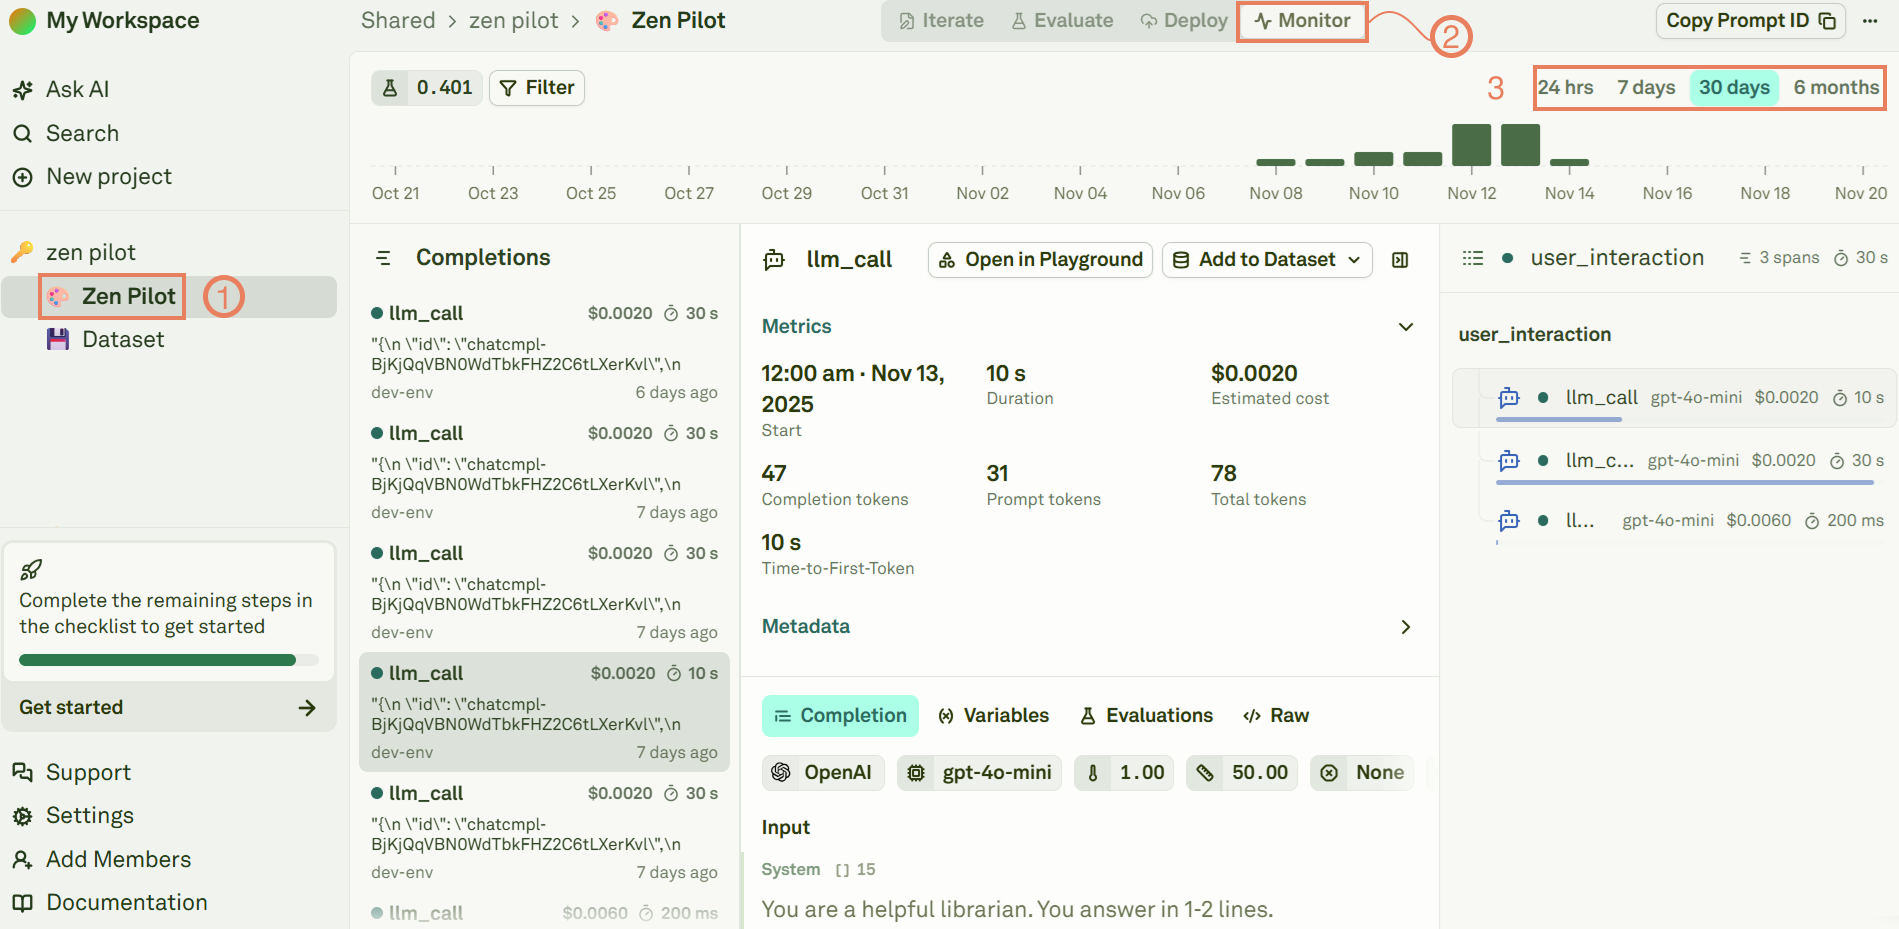
In Adaline, a prompt represents a type of LLM request happening in your AI agent / workflow. Each span sent to Adaline capturing a LLM request operation should ideally be associated with a prompt. You can view all the spans associated with a prompt in the Monitor section of your prompt. Monitor spans in Adaline
Filter Traces and Spans

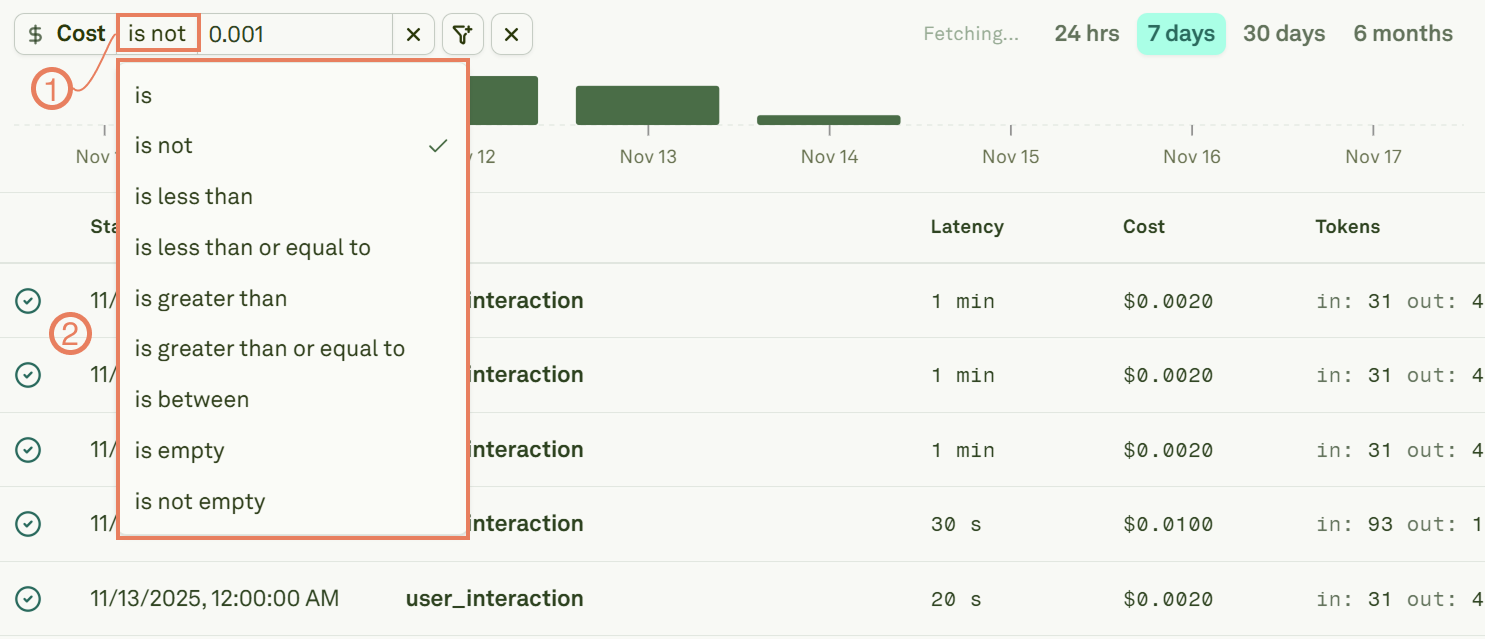
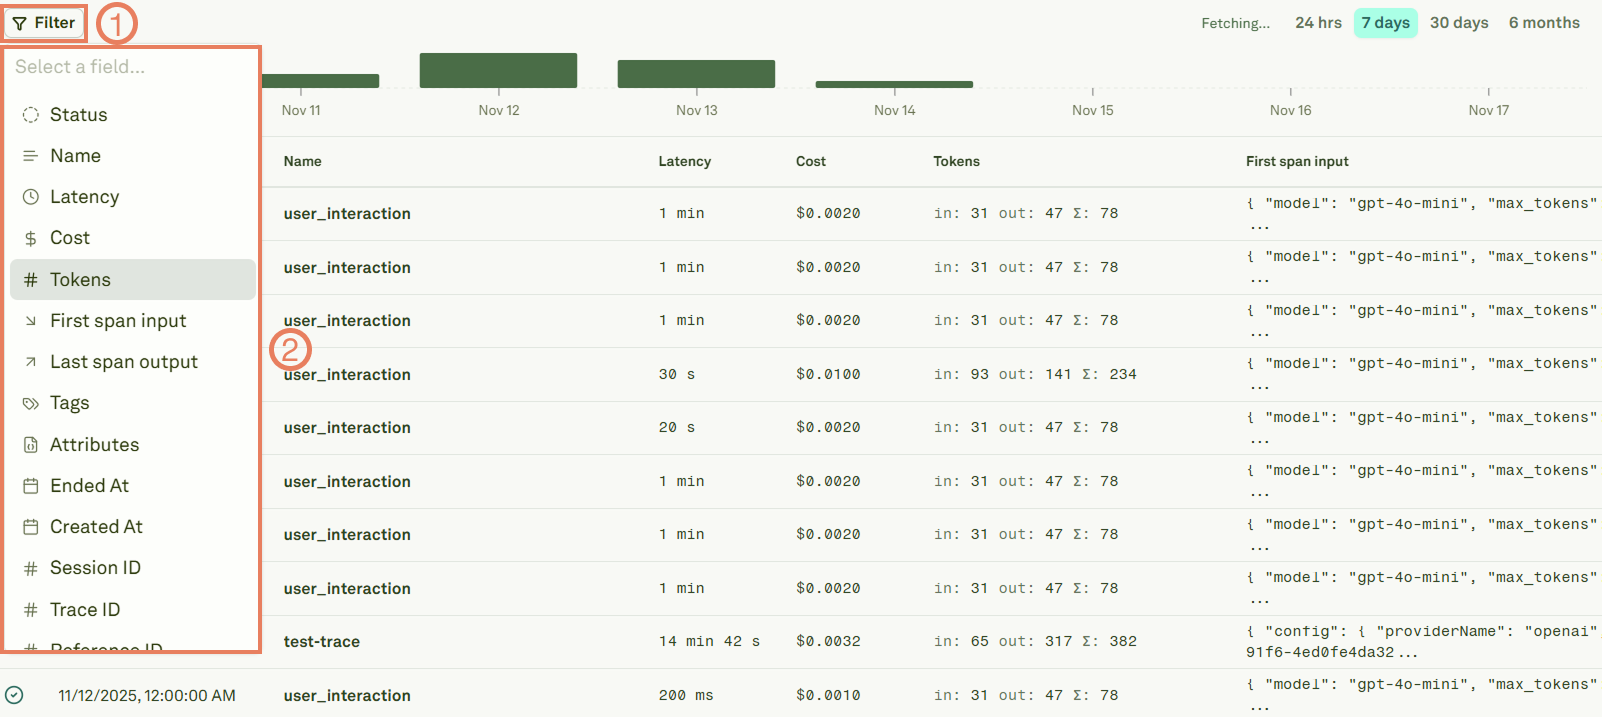
Use filters to intercept traces or spans with specific values: Filter traces and spans in Adaline For filters that require defining a number, like Cost, do the following:
1

Insert the numeric value you want to filter for

Filter traces and spans in Adaline
2

Define the mathematical logic

Filter traces and spans in Adaline